Introduction
@zaes/metoc draws every graphic of MIL-STD-2525E Change 1, Appendix M: the meteorological graphics of symbol set 45 (Atmospheric) and the oceanographic graphics of symbol set 46, plus the wind barb from Table M-I's draw rule and a station plot built from Appendix M's own symbols. It also draws the IHO S-100 marine weather warnings (S-412) and ice charts (S-411), and reads them from S-100 GML.
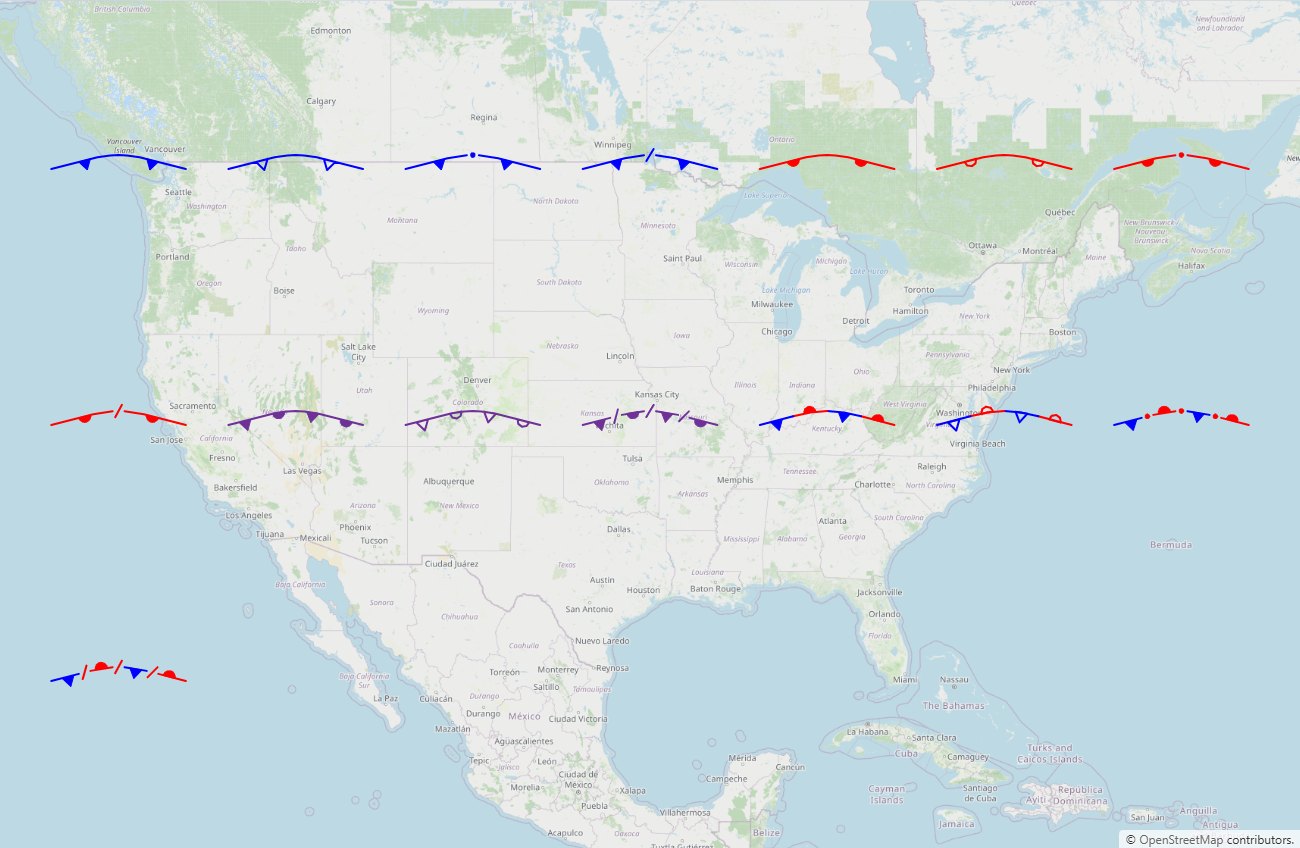
A graphic is plain GeoJSON: the points an operator drew, in drawing order, and one object of properties. The package turns that into what a map draws, on OpenLayers or MapLibre, and gives you an editor to draw and change graphics on either one.
The package
| Entry | What it is |
|---|---|
@zaes/metoc | The catalog, the paint layer, GeoJSON save and load, validation, SIDCs, thumbnails, configuration. No map library, no DOM. |
@zaes/metoc/openlayers | The OpenLayers renderer |
@zaes/metoc/maplibre | The MapLibre renderer, flat or tilted over terrain |
@zaes/metoc/editor | Drawing and editing on any renderer, undo and redo, the properties-field registry |
ol and maplibre-gl are optional peer dependencies: install the one you render with. The root entry runs in a browser, a worker or Node.
What it does
- Screen-sized decoration. Pips, dots, chevrons and rungs keep their size on screen at every zoom. They are computed per frame from the paint layer, never baked into the geometry in meters.
- Curved lines. Drawn points are joined by a curve through every one of them, as Appendix M draws fronts, and the drawn points stay the edit handles, on the line.
- The standard's colours, with an operator colour only where Table M-II leaves it open.
- One editor for every engine. The gesture rules live once and edit through the map-host seam every renderer implements.
- S-100 data. S-412 warnings and S-411 ice charts read from GML with every attribute kept, the egg code on each ice area, and exchange-set signatures checked.
- Across the antimeridian. A graphic drawn across ±180° is saved continuous and painted the short way on every engine.
Where to go next
- Getting started installs the package and draws a first graphic.
- The saved object is the GeoJSON every other page works with.
- Graphics lists what is in the catalog; the visual catalog shows every one.